Test Statistics
In the statistics area under Administration > Users > Statistics, there are two tabs available for evaluating tests: “Test statistics (detail)” and “Test statistics (overview)”.
Test statistics (detail)
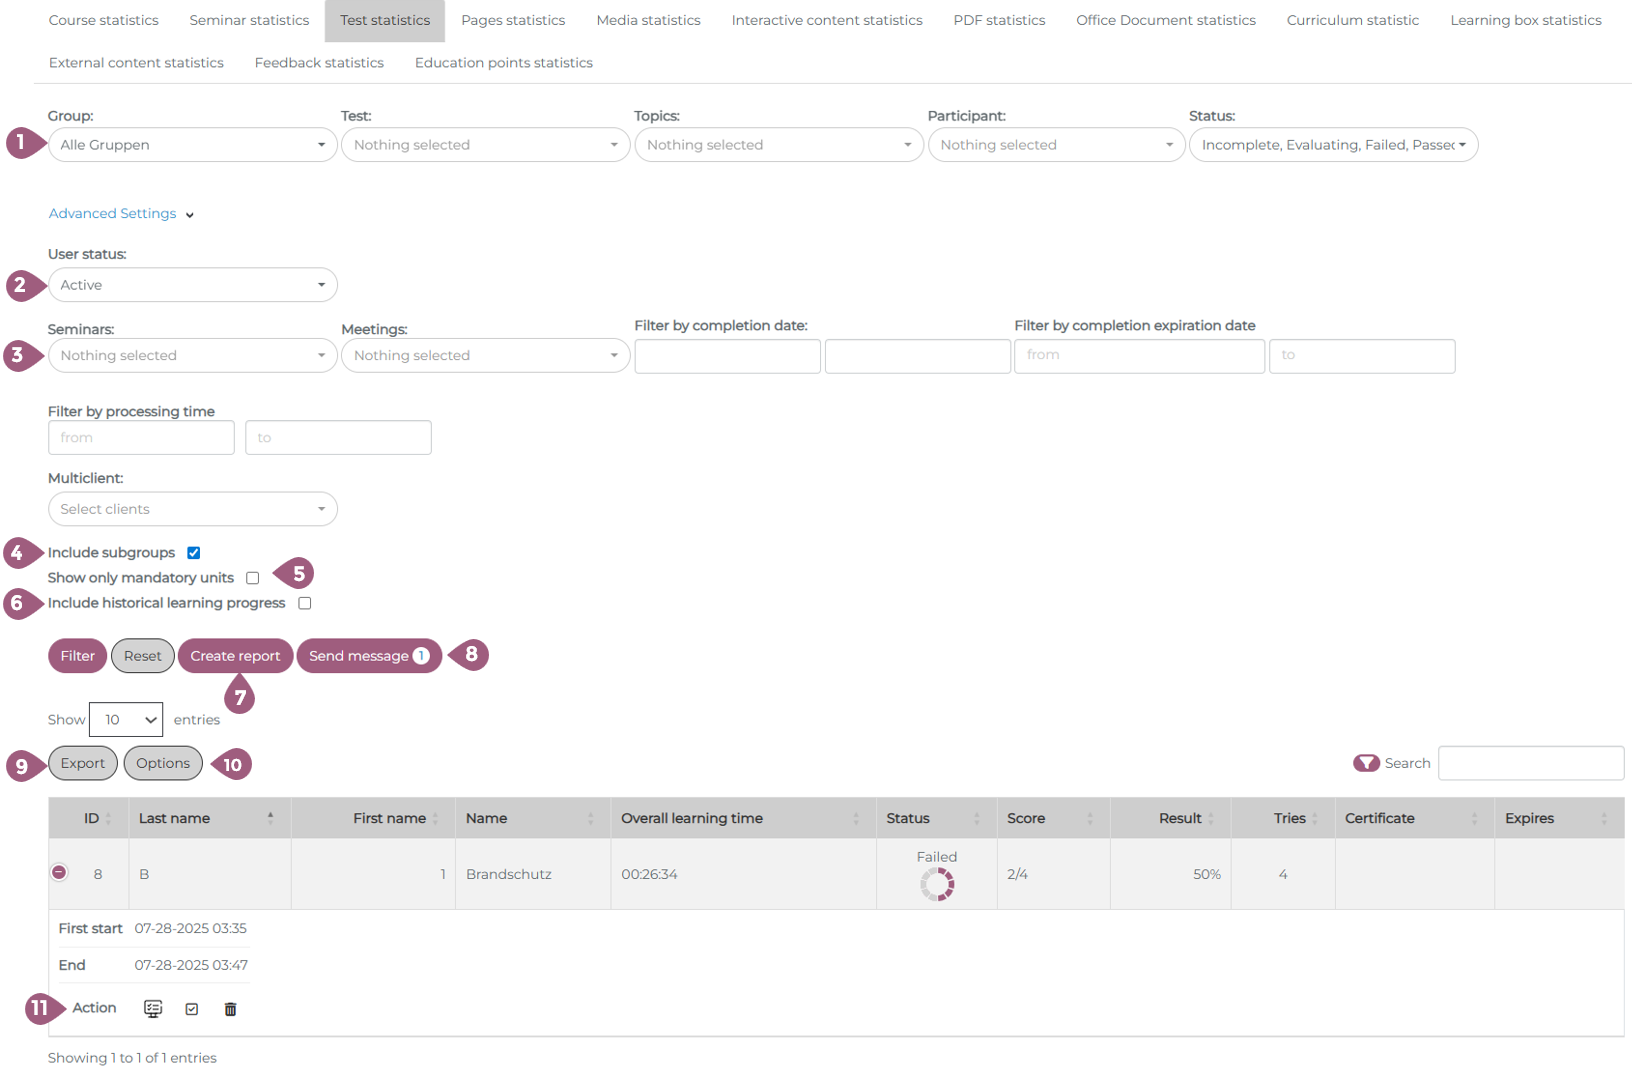
The test statistics (detail) show results for individual tests and individual learners or groups. The following filter options (multiple selections are possible) are available there:
(1) Filter by groups, individual tests, topics, participants, or status of the test (Not started / Incomplete / Evaluation / Failed / Passed)
Under “Advanced settings”:
(2) Filter by user status (active / inactive / all)
(3) Filter by Seminar and/or Meeting, periods for completion date, completion expiration, or processing time
(4) “Include subgroups” option: If this function is deactivated, only results for the group selected under (1) are displayed.
(5) Option “Show mandatory units only”: If this function is enabled, only tests that have been marked as mandatory units in the advanced settings are displayed.
(6) Option “Include historical learning progress”: If this function is enabled, expired completions are also displayed.
Note: If you want to display results with the status “Not started,” you must first deactivate the “Include subgroups” function for performance reasons and select the desired group.
(7) It is also possible to save a selection of filters by clicking on “Create report.” Saved reports allow you to reopen a specific filter setting in the “Statistical reports” tab with a single click. This is useful if a specific evaluation has to be created regularly by avoiding the need to reselect all filters each time.
(8) You can send a message directly to users based on the selected filters by clicking the “Send message” button.
(9) The results can be exported as an Excel, CSV, or PDF file using the export button. The results can also be copied or printed.
(10) It is possible to manage the visibilty of the columns of the statistics table. Using “Options” you can either make columns visible/invisible or reorder them in the table.
(11) The individual questions and answers of the user can be displayed in the “Action” column. It is also possible to delete the test and the user’s progress (trash can icon) or to manually mark the test as completed for individual users (checkbox icon).
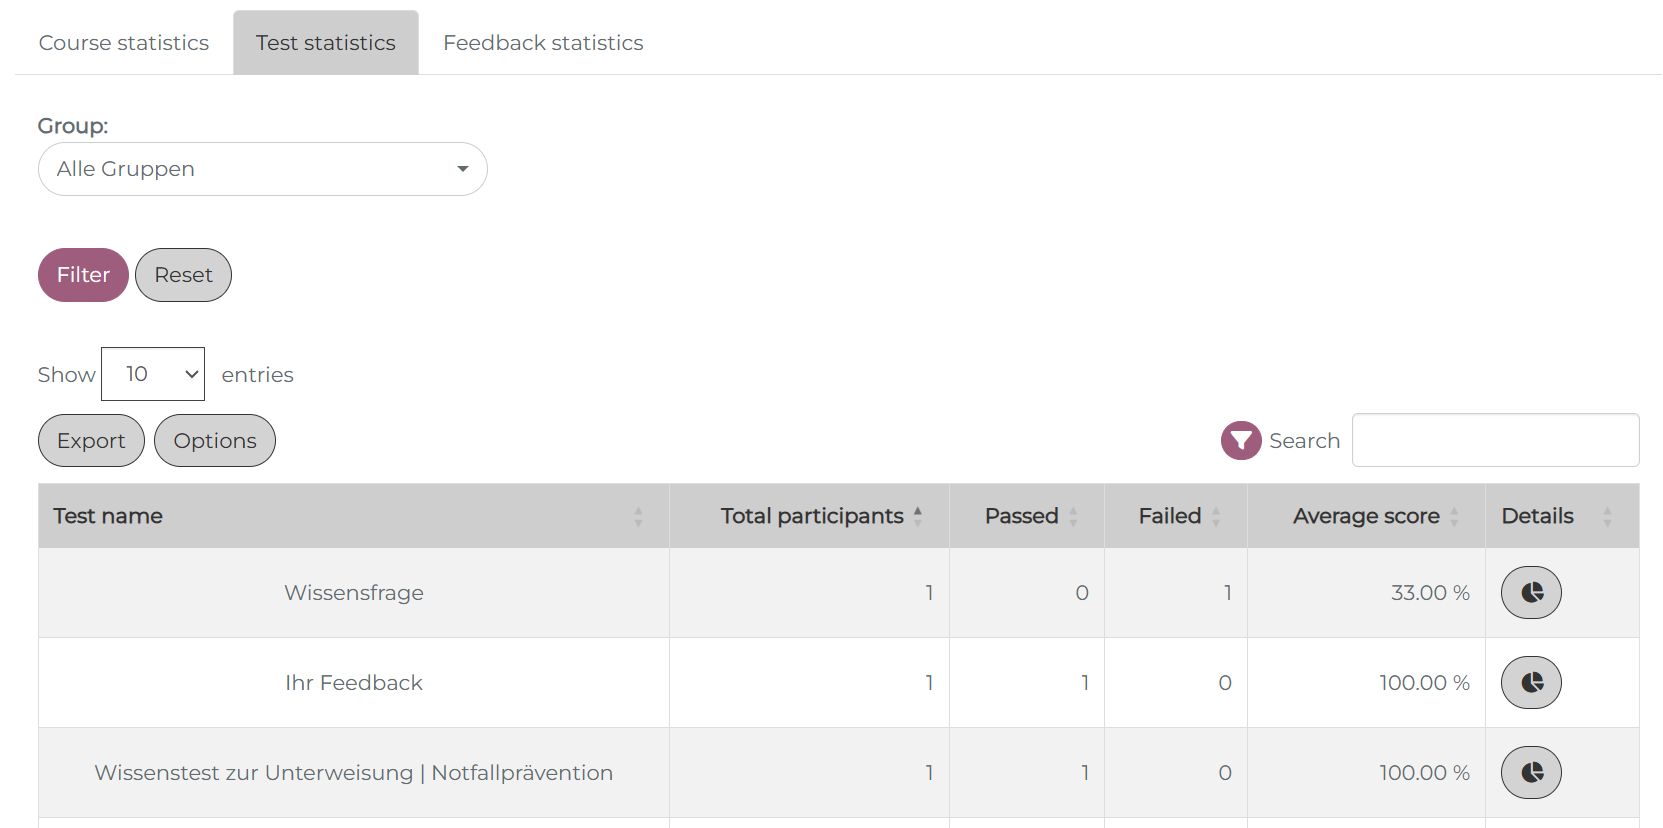
Test statistics (overview)
The “Test statistics (overview)” tab, on the other hand, provides information relating to tests as a whole, i.e. not broken down by individual users. In the first step, you can only filter by groups.
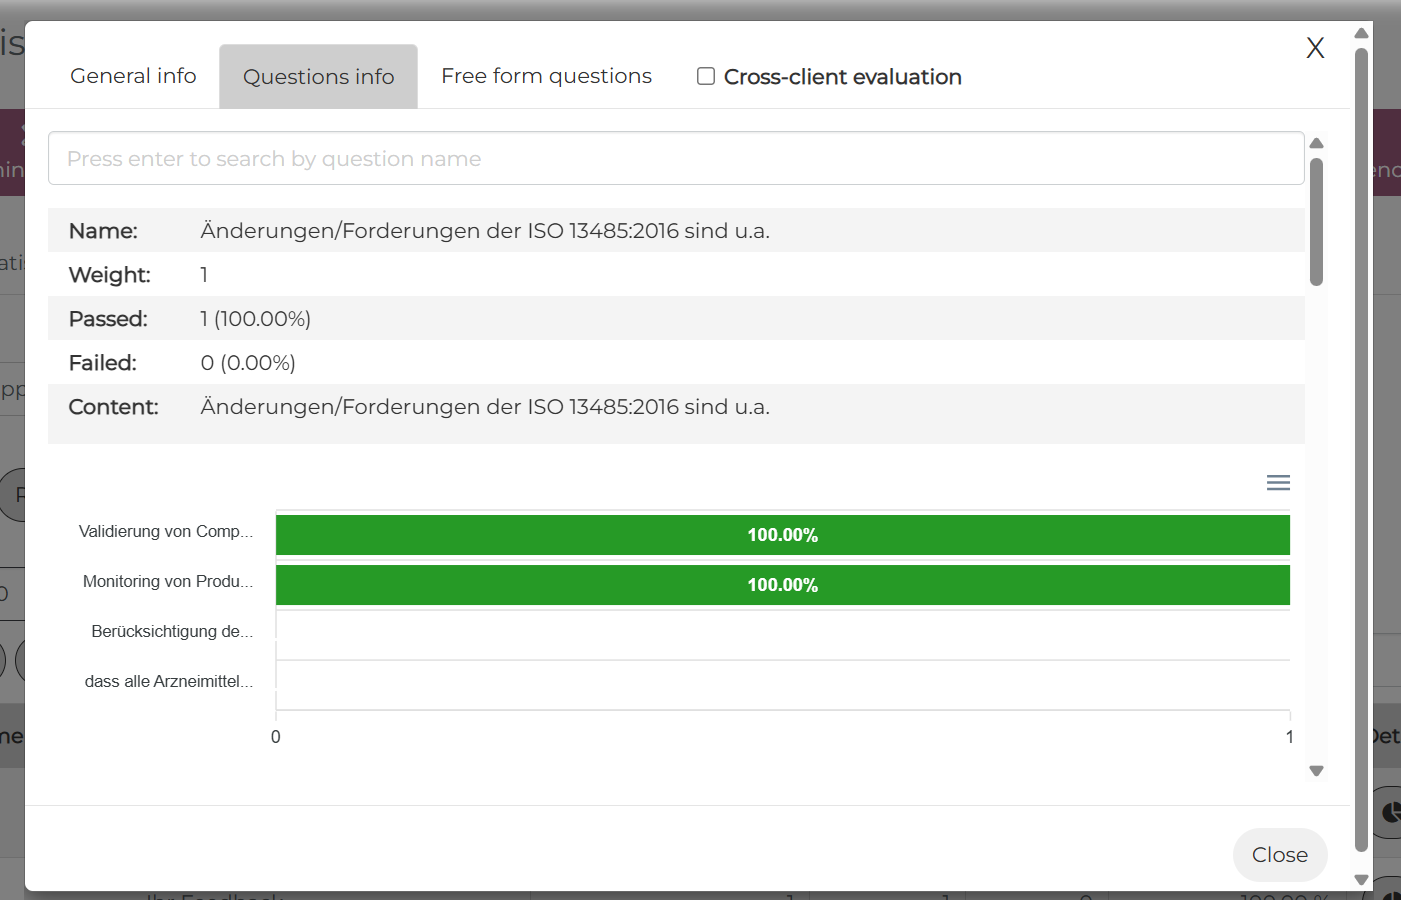
The statistics provide an overview of how many people passed the test, i.e. what percentage of users were successful or failed. At this point, it is also possible to filter by seminars or dates. The “Question Info” tab displays and evaluates the individual test questions. If the test contained an open-ended question that was not automatically marked as passed or failed by the system, it will appear in the open-ended tab.
The corresponding results are also displayed in graphs and diagrams and can be printed out: